Things that hide things
Description
LT can open a drawing with 3D solids, meshes and surfaces, and they work just as well in LT, but you can’t edit or create them with the tools available in LT. And by default, LT shows everything as a wireframe.
There are the objects that LT can create and work with and as you see here wireframe isn’t an easy way to see what is going on. When your drawing becomes more complicated this type of view quickly gets very confusing. It would be nice if we could see a model with the objects closest to us in the view covering over objects that are further in the background and/or higher in the Z-axis. This is a series of objects in model-space and is being viewed by using the -vpoint command using -1,-.07,1.2 as the point. See the page on Viewing 3D for ways to get around in 3D.

A note of explanation here: What you are seeing are different types of objects, and for each type there are 3 copies, an object is drawn and then copied in the Z direction to give us the 3 objects above each other, then the top of those 3 objects is given a thickness in the properties palette 0.5 units, this is to show which type objects have the ability to hide other objects, as you will see sometimes just a flat 2D object does this other times it has to have a thickness. Both an Ellipse and a Region cannot be given a thickness so you only see the two copies, and just for completeness, there is the point object as you see it can have thickness but you can’t do much with that for hiding anything else, still being able to have a thickness can be useful.
Now we need some way to remove hidden lines, luckily LT has several commands that allow us to see a clearer picture of how a model should look (and always has) there are
Hide
Shade
Shademode
And we’ll look at each of those here.
There are also several variables that are available that let us control how things are seen and these can affect the commands differently
- DISPSILH (System Variable)
- HALOGAP (System Variable)
- HIDETEXT (System Variable)
- FACETRES (System Variable)
- INTERSECTIONCOLOR (System Variable)
- INTERSECTIONDISPLAY (System Variable)
- OBSCUREDCOLOR (System Variable)
- OBSCUREDLTYPE (System Variable)
- SHADEDGE (System Variable)
- SHADEDIF (System Variable)
- TRANSPARENCY (Properties)
Hlsettings opens a dialogue that shows and alters a few of these settings
And then we need objects that work for each of these commands, a line works well in 3D space, but a line remains a line and drawing a cube with just lines will always remain a wireframe (well almost always, I’ll explain later)
Solid (2D)
Circle
Ellipse
Wide polyline
Region
Object with a thickness (line, polyline including polylines with width, circle, arc)
*Ellipse and Region will hide other objects but cannot have a thickness
**Solid as 2D will only hide other objects when ‘shademode=hidden’, unless it has a thickness then it also works when ‘hide’ or ‘shade’ are active
***Point can have thickness but the result resembles a line and so can’t hide other objects
I have seen people get really clever with isometric drawings using hatches to create the illusion of 3D objects but hatches aren’t usable for hidden line removal they are controlled by the draw order and even a hatch placed below another hatch in the Z height will show as being above and a solid hatch will disappear in all the hidden view commands. However, when combined with other objects that do hide other geometry then normal hatch patterns can be used to great effect.
Hide Command

The ‘hide’ command will allow some types of object to hide other objects. Notably here a solid (2D) doesn’t hide other objects but it will when it has a thickness.
Shade Command

From a visual point of view, this command gives you a lot of options for creating 3D imagery, firstly it has 4 sub commands in the menubar
- 256 color – shown above it uses the 256 colors from the standard autocad color chart if you use any other colors like true color it will just use the closest it finds the 256 colors (this is color 254)
- 256 edge highlight – that is the image here below which can often make the details a lot cleaner to see.
- 16 color hidden line – (no image) behaves in the same way as the hide command.
- 16 color filled – (no image)works the same as edge highlighting in option 2.

Then from here things get interesting, there are a number of variables that affect how all these commands work and for the shade command the variable ‘shadedif’ is worth getting to know the default value for this is ‘shadedif=0’ the shade command is a very basic render and it takes into account a light source positioned in the same place as you are viewing the model from and shadedif tells the program how much diffuse reflective light to calculate, you will notice in the image above how surfaces at different angles to each other have a slightly different tint, this is more noticeable on the curved areas. The two images above use the default value of ‘shadedif=70’ now take a look at how that can change the appearance here is an image using ‘shadedif=100’ (these are percentage values).

And the next image uses ‘shadedif=0’ this also the type of shading you see from an isometric view when using cubic objects drawn square to the X and Y axis, in cases like that all surfaces are at the same angle away from you and so have the same reflective properties. This is where edge highlighting is a good option.

Shademode Command

Something I haven’t mentioned with the other two commands is that they both freeze your screen, with ‘hide’ and ‘shade’ you can no longer pan in the drawing or select objects, you have to use the ‘regen’ command which puts the drawing back into wireframe mode, using the scroll wheel will also change back to wireframe. As you can probably imagine with a large drawing and many objects it is going to get hard to see which lines belong to the front or back of your objects and even which object they belong too when you start to zoom and pan around, if all you can see is a wireframe model. This is one of the benefits of this next command ‘shademode’ which shows you a dialogue box with two options
- 2D wireframe – this is the default viewing option
- Hidden – this option works in a similar way to the hide command but in this mode, you can pan and zoom around your model and hidden lines remain hidden, however, the hide command no longer works and unfortunately neither does the shade command.
And if you are paying attention you might also notice a slight difference in how objects behave a circle and an ellipse no longer hides objects, also a thickened circle loses its end, but now a flat 2D solid will hide other objects. One other disadvantage to shademode is that any solid hatching is no longer visible its there and you select an edge of the hatch you just can’t see it so be very carefull using this mode if you have solid hatches in your drawing or you could posiibly lose hatches in some of your editing processes
Find the command
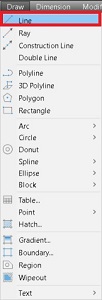
Ribbon – Home(TAB) – Draw(PANEL)

Menu – Draw(TAB)

Draw(TOOLBAR)
Command line type “line”
At the command line you can type the word ‘line’
Alias type “l”
Just typing the letter ‘l’ will also start the line command
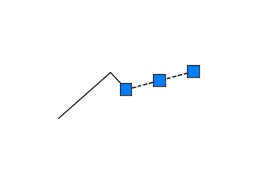
Grips

A line has two types of grips associated to it,
END grips and a MID grip.
When grip editing the END grips will allow you to distort the original line to change it’s position, angle and length.
The MID grip can be used to alter the placement, rotation and scale of the line.
When using osnaps from other objects a line can also display points for PERpendicular and NEArest, as well as INTersection and APParent intersection
Editing
You can directly change a line by using grip editing, or by using one of the following commands
- Move
- Stretch
- Rotate
- Scale
- Lengthen
- Trim
- Extend
- Join
- Pedit
Properties
The following properties are displayed in the properties palette when a line is selected.
General
· Color
· Layer
· Linetype
· Linetype scale
· Plot style
· Lineweight
· Transparency
· Hyperlink
· Thickness
Geometry
· Start X
· Start Y
· Start Z
· End X
· End Y
· End Z
· Delta X
· Delta Y
· Delta Z
· Length
· Angle
List properties
When using the List command the following properties are noted.

This can have additional information if the properties of a line are edited so you can also have the information for
- Color
- Linetype
- Linetype scale
- Plot style
- Lineweight
- Transparency
- Hyperlink
- Thickness
if these have been changed from the default values.
Variables
The following is a list of the variables that can have an affect on Lines
- Elevation
- Lastpoint
- Thickness
Script example
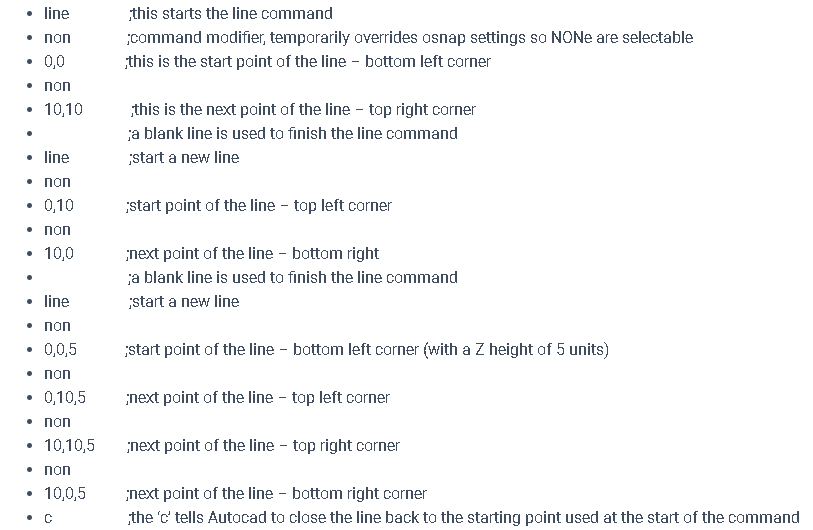
Read the section on creating scripts for full details on how scripts work in Autocad, the following is an example for using the line command in a script
——script start——
[membership level=”0,1″]
[/membership]
[membership level=”2,3″]
- line
- non
- 0,0
- non
- 10,10
- line
- non
- 0,10
- non
- 10,0
- line
- non
- 0,0,5
- non
- 0,10,5
- non
- 10,10,5
- non
- 10,0,5
- c
[/membership]
——script end——
Description
 This short script file will draw a square with diagonal lines across the corners. Make sure there are no extra spaces at the end of lines in a script, and a blank line is totally empty (no spaces).
Before entering coordinates you should always use the command modifier ‘non’ to stop Autocad snapping to osnap points, this subject is covered in the scripting section but it is always a good idea to do this before every single set of coordinates in a script as it is only valid for one point at a time.
[membership level=”0,1″]
[/membership]
[membership level=”3″]
[/membership]
Macro example
This short macro will draw a square with diagonal lines across the corners. Make sure there are no extra spaces Autocad treats a space the same as a semicolon and see’s them the same as using the key.
Before entering coordinates you should always use the command modifier ‘non’ to stop Autocad snapping to osnap points, this subject is covered in the macro section but it is always a good idea to do this before every single set of coordinates in a macro.
[membership level=”0,1″]
[/membership]
[membership level=”2,3″]
^C^C^Cline;0,0;10,10;;line;0,10;10,0;;line;non;0,0,5;0,10,5;10,10,5;10,0,5;c;
[/membership]
3D
A line is free of any 3D issues, it doesn’t rely on the current UCS settings unlike some other types of geometry that are required to be on or parallel to the current UCS. A line can be placed anywhere in 3D space just by using 3D coordinates when you create it, or edit an existing line.
If you have the variables ‘elevation’ or ‘thickness’ set to anything other than default then any new lines will inherit these properties, unless you use 3D coordinates then elevation will be ignored.
The only way that a line is linked to the UCS is when you give it a thickness, a line is thickened in the Z direction that was in operation when the line was originally created, you will see this referred to as the “normal” in some programs.
Because of this freedom, a line possesses it makes it an excellent choice for working in 3D however, it also means that if you unknowingly have 3D elements in your drawing that a line can take on the Z value if you snap to any 3D points.
This section is just for creating Image for script with comments and should be deleted for web
the bulleted list uses standard line height, set in the topography (style tab) line height. You can import text from notepad but in notepad you have to add a blank line between every line of text and 2 blank lines if you wish to show an empty bullet.
the comments column again uses standard topographical line height but uses a <br> html tag to provide line breaks this needs doing in the ‘text’ tab of elementors text editor.
It is probably easier to create the scripts here in elementor and delete things in notepad (a blank bullet will give 2 linefeeds in notepad).
To create a notepad script with comments copy the two sets of text separately and paste into 2 columns in excel then run a macro to add the lines in the correct order to copy/paste back into notepad, you can even get excel to create the scr file directly.
- pline
- non
- 0,0,5
- non
- 0,2
- non
- -2,2
- non
- -2,4
- non
- 0,4
- non
- 0,6
- non
- 2,6
- non
- 2,4
- non
- 4,4
- non
- 4,2
- non
- 2,2
- non
- 2,0
- c
;starts the polyline command
;command modifier, temporarily overrides osnap settings so NONe are selectable
;starting point for the polyline with a Z height of 5 units
;the polyline command won’t accept 3D coordinates after the first point is set
;closes the polyline back to the starting point


